TL;DR
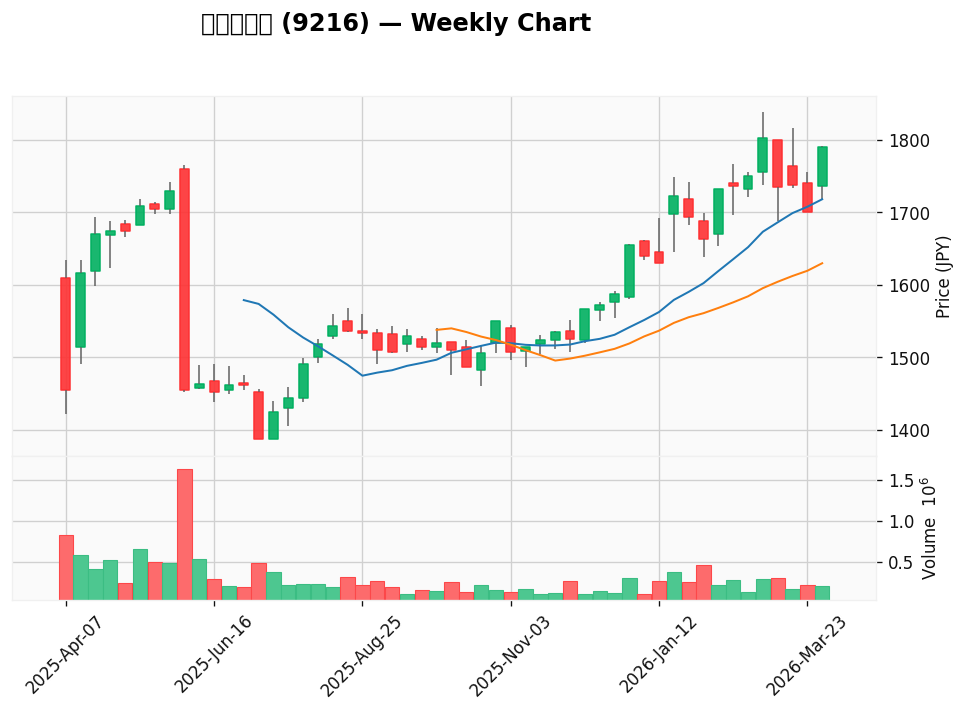
- Ticker: 9216 (TSE Prime)
- Entry Price: ¥1,790
- Market Cap: ¥25.28B
- NCAV Ratio: 0.02x | Net Cash Ratio: 0.02x
- Screen Result: FAILS all three criteria (NCAV too low, revenue declining, but operating profit positive)
- Thesis: This doesn’t qualify as a net-net, but the deteriorating profitability combined with extreme cheapness on a net-cash basis warrants closer investigation before dismissing outright.
About the Business
Bewith operates in the Services sector (Sector 33), classified specifically under IT & Services, Others (Sector 17). I’m honest here: the fact sheet doesn’t give me specific details about what Bewith actually manufactures, operates, or owns. I know it has ¥14.49B in total assets and ¥8.95B in equity, but without recent IR disclosures or a deeper dive into their business model, I can’t confidently describe their physical footprint, facility locations, or core revenue drivers. This is a critical gap in my analysis — a small-cap Japanese services company could be anything from a staffing firm to a software developer to a facilities manager. That uncertainty alone should make me cautious.
What I do know: the company generated ¥36.42B in revenue as of the latest fiscal year, but that revenue has contracted at a 1.6% CAGR over the past three years. That’s a red flag. The operating profit of ¥1.07B represents a meaningful deterioration from ¥2.54B two years ago — a 58% decline. That’s not a minor wobble; that’s structural pressure on the business.
Valuation Gap
Let me be precise about the distinction between Net Cash and NCAV, because they’re often confused:
Net Cash = Cash & Equivalents − Total Liabilities
For Bewith: ¥6.08B − ¥5.54B = ¥0.54B
This represents the literal cash cushion after paying off all debt. It’s the most conservative measure of intrinsic value — if the company liquidated tomorrow and burned through all operations, shareholders would theoretically have ¥0.54B left.
NCAV (Net Current Asset Value) = Current Assets − Total Liabilities
For Bewith: ¥0.54B (same result in this case, which suggests that current assets are essentially just cash; the company isn’t sitting on significant inventory or receivables that could be converted to cash).
Both metrics yield ¥0.54B, or a ratio of 0.02x against the ¥25.28B market cap.
This does NOT qualify as a net-net by any reasonable definition. A genuine Graham net-net trades below 0.67x NCAV (often cited as the traditional threshold). A stock trading at 0.02x is not a margin-of-safety play; it’s a speculative crater. The market is pricing Bewith at 46.7x its net-cash value.
Why such an extreme discount? I have three hypotheses, and I’m genuinely uncertain which applies:
- The market has priced in structural decline — the -1.6% revenue CAGR and the -58% operating profit collapse suggest the business is in secular contraction.
- Management is passive or locked in — with no recent IR disclosures, there’s radio silence. That silence can be deafening in a value context; it often means management isn’t activating shareholder value.
- The ¥14.49B in total assets are not as liquid or high-quality as they appear. Current assets might include slow-moving inventory, doubtful receivables, or other non-cash items that the balance sheet carries at book value but would fetch less in a distressed sale.
Without access to the detailed balance sheet breakdown and management commentary, I’m shooting in the dark.
Financial Trends
Let me state the numbers plainly:
| Metric | 2 Years Ago | Latest |
|---|---|---|
| Revenue | ¥38.25B | ¥36.42B |
| Operating Profit | ¥2.54B | ¥1.07B |

YoY Revenue Change: ¥36.42B vs. ¥38.25B = -4.8% decline over two years, or -1.6% CAGR.
YoY Operating Profit Change: ¥1.07B vs. ¥2.54B = -57.9% collapse over two years.
This is the core problem. The company isn’t just failing to grow; it’s actively shrinking, and profitability is evaporating far faster than revenue. The operating margin compressed from roughly 6.6% (¥2.54B / ¥38.25B) to 2.9% (¥1.07B / ¥36.42B). That’s a margin squeeze, not a recovery.
The EPS figure (¥32.1) doesn’t tell me much without knowing the share count or comparing it to historical years, but combined with declining profit, I’d expect earnings per share to be under pressure as well.
Catalysts
Here’s where I have to be honest: I don’t have much to work with. The fact sheet lists “No recent disclosures available,” which is itself a negative signal. In the Japanese market, companies that are serious about shareholder value typically communicate actively — earnings calls, earnings releases, shareholder updates, strategic announcements.
The absence of recent IR disclosures suggests one of two things:
- Management is focused on operational turnaround and not ready to make strategic announcements.
- Management is passive and not communicating with the market at all.
If I were to invest in Bewith, I’d be waiting for:
- Q-over-Q stabilization of operating profit — even a flat quarter would signal the margin collapse has halted.
- An earnings release or management commentary that explains the -1.6% revenue decline and the -58% profit collapse. Is this structural? Cyclical? A one-time charge?
- Asset sales or restructuring announcements — if Bewith is carrying non-core assets, a sale could unlock value and reduce the leverage ratio.
- Dividend or buyback announcement — if management believes the stock is undervalued (which it clearly is on any conventional metric), they should signal that conviction through capital allocation.
Without these signals, I’m flying blind.
Risks
-
Liquidity risk: Small-cap Japanese stocks, especially in the Services sector, often trade with thin volumes. A ¥25.28B market cap company might have days or weeks where no one wants to buy or sell at any price. Position sizing is critical; I’d never allocate more than 0.5–1% of a portfolio to Bewith unless I was prepared to be patient for years.
-
Value trap risk: The stock is statistically cheap by any metric (0.02x net cash). But statistical cheapness and true value are not the same thing. If the business is in genuine secular decline — if the Services sector is consolidating and Bewith is losing market share — then the company could trade sideways or down for a decade while I wait for a catalyst that never comes.
-
Profitability deterioration risk: Operating profit has collapsed 58% in two years. If that trend continues for another year, the company could flip to a loss. A loss-making company is no longer a “net-net” by any definition; it’s a potential going-concern issue. Without knowing the cash burn rate, I can’t rule this out.
-
Balance sheet opacity risk: I don’t have a detailed breakdown of the ¥14.49B in total assets. If a significant portion is intangible assets (goodwill, capitalized software), those are at risk in a downturn. If it’s receivables from customers in financial distress, that’s a problem too.
Final Verdict
Bewith does NOT qualify as a net-net investment by my screening criteria. The NCAV ratio of 0.02x is so far below the 0.5x threshold that it’s not even in the same category.
However, I’m not dismissing it outright.
The company has ¥6.08B in cash against a ¥25.28B market cap — that’s a meaningful cash position. The operating profit, though deteriorating, is still positive at ¥1.07B. That suggests the business is not in a death spiral yet.
My current stance: Watchlist, not a position.
I’d be a buyer if:
- Q2/Q3 2026 earnings show stabilization — flat or slightly positive operating profit growth.
- Management releases a strategic statement — clarity on why revenue is declining and what they’re doing about it.
- The stock drops another 20–30% — at 0.01x net cash, the downside is more limited, but I’d want even more margin of safety.
Over the next 3–6 months, I’ll be monitoring Bewith’s quarterly releases for signs of life. If they stabilize margins and communicate a turnaround plan, the stock could be a 2–3x opportunity for a patient investor. If they continue the decline in silence, it’s a value trap, and I’ll move on.
For now, I’m watching, not buying.
This analysis was generated on 2026-03-30 and is based on publicly available data from the fact sheet provided. Small-cap Japanese stocks carry liquidity and volatility risks. This is not financial advice. Do your own due diligence, and consult a licensed advisor before making investment decisions.