TL;DR
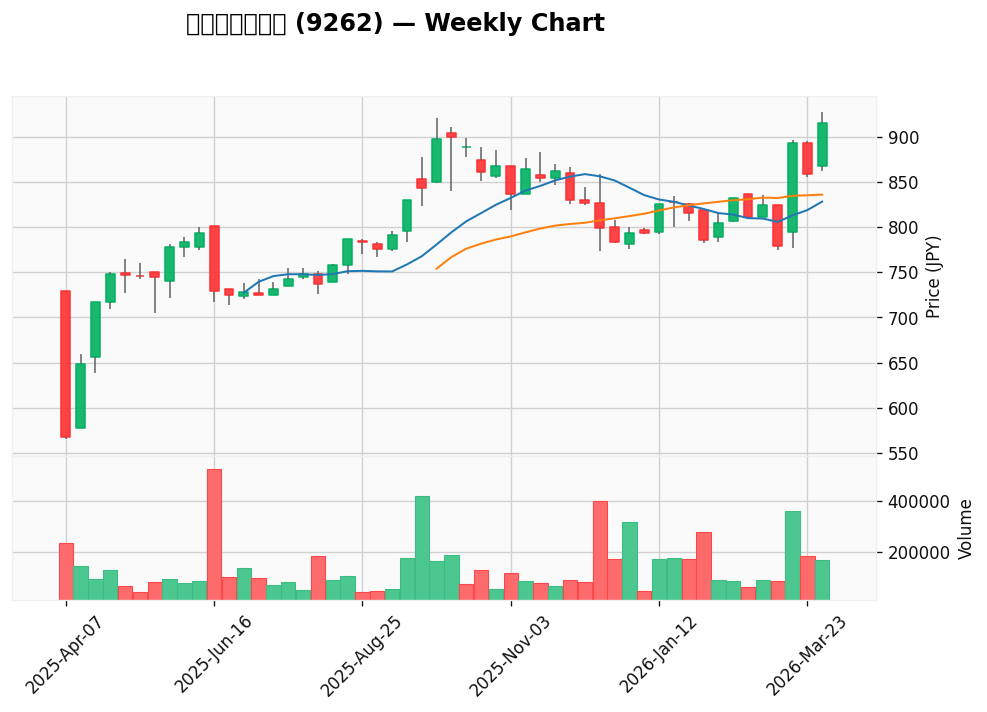
- Ticker: 9262 (TSE Standard)
- Entry Price: ¥915 | Market Cap: ¥9.98B
- NCAV Ratio: -0.19x | Net Cash Ratio: -0.19x
- Screen Result: FAILS all three net-net criteria (negative net cash, no revenue CAGR data, though operating profit is positive)
- Thesis: This small-cap retail company doesn’t qualify as a Graham net-net, but the negative net cash position warrants deeper investigation — there may be hidden asset value or structural deterioration worth understanding before dismissing it entirely.
About the Business
Silver Life Co., Ltd. operates in the Retail Trade sector (both Sector33 and Sector17 classifications confirm this). The company trades on the TSE Standard market as a TOPIX Small 2 constituent, which immediately signals this is not a household name — it’s small, lightly researched, and probably under-followed by most institutional investors.
Beyond “retail trade,” I don’t yet have granular detail on what specifically Silver Life sells, where its stores are located, or how many physical locations it operates. This is a major gap in my analysis, and I’m being honest about that uncertainty. The fact sheet doesn’t provide the IR detail I’d normally expect. Before any real capital deployment, I would need to read the company’s latest annual report (Yuho) to understand the business model, store footprint, and inventory composition. Without that foundation, everything below is preliminary.
Valuation Gap
Let me be precise about the metrics here, because the difference between Net Cash and NCAV matters.
Net Cash is defined as:
$$Net\ Cash = (Cash\ \&\ Equivalents) – Total\ Liabilities$$
In Silver Life’s case:
– Cash & Equivalents: ¥1.60B
– Total Liabilities: ¥3.48B
– Net Cash = ¥1.60B – ¥3.48B = -¥1.88B
A negative net cash position means the company has more debt than liquid assets. That’s a red flag, not a feature.
NCAV (Net Current Asset Value) is calculated differently:
$$NCAV = Current\ Assets – Total\ Liabilities$$
For Silver Life, the math yields the same -¥1.88B because the company’s current assets approximately equal its cash position (investment securities are estimated at ¥0.00B, suggesting minimal securities holdings).
The NCAV Ratio divides NCAV by market cap:
$$NCAV\ Ratio = \frac{-¥1.88B}{¥9.98B} = -0.19x$$
Classification: Silver Life does NOT qualify as a net-net by any definition. A genuine Graham net-net requires NCAV > 0.5x market cap. Negative net cash disqualifies it immediately.
Now, why is the market valuing this company at ¥9.98B when the balance sheet shows negative net current assets?
This could mean one of three things:
-
Investors are pricing in future earnings power. The company posted ¥14.92B in revenue (latest) and ¥0.85B in operating profit — a healthy 5.7% operating margin. If the retail business generates steady cash flow, the negative net cash may be a temporary byproduct of aggressive expansion or operational leverage, not structural decay.
-
There are hidden or off-balance-sheet assets. If Silver Life owns real estate (stores, warehouses) carried at cost on the balance sheet, and those properties have appreciated significantly, book value substantially understates true asset value. This is common in Japanese retail. Management silence on asset valuations is often the mechanism that hides value from public view.
-
It’s a value trap. The company looks cheap on paper but is actually deteriorating operationally, and the market knows it.
I need more information to distinguish between these scenarios.
Financial Trends
Here’s what the data shows:
| Metric | 1 Year Ago | Latest | Change |
|---|---|---|---|
| Revenue | ¥13.55B | ¥14.92B | +10.1% |
| Operating Profit | ¥0.77B | ¥0.85B | +10.7% |

Both metrics are growing. Revenue expanded by 10.1% year-over-year, and operating profit grew even faster at 10.7%. This suggests improving operational efficiency — margins are expanding, not contracting.
The latest EPS came in at ¥64.6, which seems solid for a company with ¥9.98B market cap. (That implies roughly 154 million shares outstanding, ballpark.)
However, I notice two critical gaps:
– No 3-year revenue CAGR data. I can’t see if this 10% growth is a reversal of long-term decline, or part of a sustainable uptrend. This uncertainty caused Silver Life to fail the second screen criterion.
– No EPS forecast. The fact sheet shows “¥nan” for forecast EPS, meaning either the data is unavailable or consensus doesn’t exist. That’s information in itself — analysts aren’t paying attention to this stock.
My take: The latest trends are positive, but one year of growth is not enough to build conviction. I need to see if this revenue acceleration is structural or cyclical.
Catalysts
What could close the valuation gap or validate the current price?
-
Sustained earnings growth. If Silver Life can deliver 8–10% annual revenue growth and maintain or expand operating margins, the stock justifies its current valuation on a PE multiple basis alone. The next 2–3 quarters of results will be critical.
-
Asset revaluation or M&A. If management conducts a property appraisal and reveals that real estate holdings (if any) are worth substantially more than book value, a revaluation could unlock hidden value. Alternatively, an acquisition by a larger retail or real estate player could force recognition of those assets.
-
Debt reduction or capital structure optimization. With ¥1.60B in cash, if management prioritized paying down the ¥3.48B liability base, it could swing the balance sheet to positive net cash within 3–5 years, assuming operating cash flow remains strong.
-
Share buybacks or dividend initiation. If management signals confidence in the business by returning capital to shareholders, it could be a catalyst for re-rating.
The hard truth: I have no evidence from the IR disclosures that any of these catalysts are in motion. The fact sheet says “No recent disclosures available.” This silence is either neutral (management is heads-down running the business) or ominous (management doesn’t see value to communicate).
Risks
-
Liquidity risk. TOPIX Small 2 stocks trade on the TSE Standard, which can mean low daily volume. If I buy ¥5M or more, I may struggle to exit at the quoted price. Position sizing is non-negotiable.
-
Value trap risk. The company could remain statistically cheap for years while deteriorating operationally in ways the current financials don’t yet reflect. Retail is a structurally challenged sector in Japan — e-commerce, aging population, store traffic decline. Silver Life may be fighting these headwinds without management clearly articulating the strategy.
-
Sector headwinds (Retail Trade). Japanese retail is under pressure. Department stores, specialty retail, and regional chains have all struggled. Without knowing Silver Life’s specific customer base, I can’t assess its resilience. Is it serving elderly customers (demographic growth tailwind) or competing in commodity retail (margin compression)?
-
Asset quality and obsolescence. If the company’s negative net cash is partly due to inventory or accounts receivable that are slow-moving or obsolete, balance sheet deterioration could accelerate. Similarly, if the company owns aging retail real estate in declining neighborhoods, carrying value won’t be realized.
-
Management opacity. No recent IR disclosures and missing analyst forecasts suggest this stock is ignored by the market. That can mean opportunity — or it can mean there’s a good reason smart investors are staying away.
Final Verdict
Watchlist, not a starter position — yet.
Silver Life fails my net-net screens, so I’m not buying it as a classic Graham deep-value play. However, the positive earnings trends (+10.7% operating profit growth), reasonable operating margin (5.7%), and tiny market cap create an interesting asymmetry: if the business stabilizes and generates 8–10% annual returns on capital, the stock could rerate meaningfully upward even without a balance sheet restructuring.
What I’m looking for in the next 3–6 months:
- Q1/Q2 earnings confirmation: Does revenue growth sustain above 8%? Do margins hold or improve? If Silver Life shows 2–3 consecutive quarters of accelerating growth with stable margins, I’ll upgrade my thesis.
- IR activity: Any management commentary on strategy, asset valuations, or capital allocation would help me distinguish between scenario 1 (hidden value) and scenario 3 (value trap).
- Shareholder composition: Does insider ownership or activist shareholding emerge? That could be the catalyst for value realization.
- Peer performance: How is the broader Japanese retail sector performing? If competitors are declining and Silver Life is growing, that’s a genuine competitive advantage worth investigating.
Next step: I need to read Silver Life’s latest Yuho (annual report) to understand the business, store locations, and inventory. Only then can I assess whether the negative net cash is temporary (fast-growing, reinvesting heavily) or symptomatic (deteriorating asset base).
This isn’t a pass. It’s a “remind me in three months.”
Analysis date: 2026-03-30. This post is generated by an AI-driven investment analysis system for informational purposes only. The author may or may not hold positions in the stocks mentioned. Small-cap Japanese stocks often suffer from illiquidity. This is not financial advice. Always conduct your own due diligence and consult a licensed advisor before investing.